We Analyzed 2M+ Pharma Payments to Clinical Sites. Here's What We Found.
We analyzed 2M+ pharmaceutical payments to clinical sites and mapped them back to 10,000 clinical trials. The big takeaway: cost per site has been relatively stable since 2014, despite a massive increase in protocol complexity.
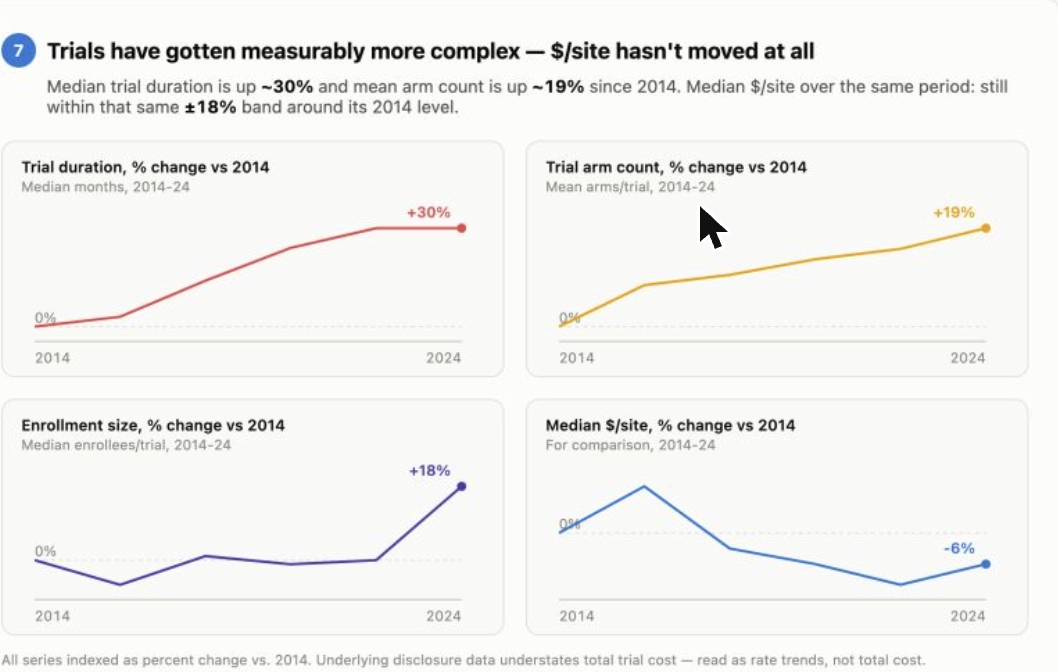
Median trial duration is up roughly 30% since 2014. Mean arm count is up roughly 19% over the same period. Median enrollment per trial is up 18%. Meanwhile, median dollars per site sits within an 18% band of where it was a decade ago — essentially flat once you account for normal year-to-year noise.
Sites are clearly taking on more burden: longer trials, more arms to manage, more patients to enroll and track. Compensation has not kept pace.
Why the gap matters
That gap matters: sites absorbing more work without more pay is a leading indicator of coordinator turnover, slower enrollment, and site drop-off — the kind of risk that shows up in your timelines before it shows up in your budget.
Want the numbers behind your own trials?
We built this analysis using our extensive payments and financial dataset spanning thousands of trials and sites. If you want real-time, cutting-edge financial benchmarking for your own clinical operations — comparing your site compensation against comparable trials in your therapeutic area — reach out to us at research@rightview.ai and we'll send over a custom report.